|
3.3. Regional and Global-Scale Impact of Aviation on Aerosols
3.3.1. Global Aircraft Emissions and Aerosol Sources
Aircraft emissions may cause changes in the background distribution of soot
and sulfuric acid aerosols at regional and global scales. In this section, observations
and model results are used to evaluate these potential aircraft-induced changes.
Soot and sulfur mass emissions from aircraft are small compared with other
global emissions from anthropogenic and natural sources (Table
3-2). However, aircraft emissions occur in the upper troposphere and lower
stratosphere, where background values are lower and removal processes are much
less effective than near the Earth's surface. Moreover, aircraft aerosol particles
tend to be smaller than background particles, so small emission masses may still
cause large changes in aerosol number and surface area densities. In addition,
aerosol particles from aircraft can participate in the formation of contrails
and clouds in the upper troposphere, hence potentially alter the radiative balance
of the atmosphere (Section 3.6).
|
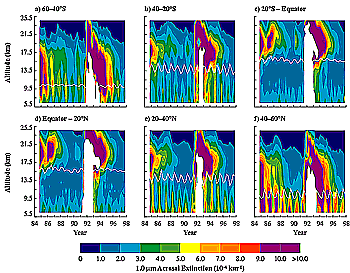
Figure 3-6: Aerosol extinction at 1.02 µm from SAGE II satellite
observations at altitudes of 6.5 to 24.5 km.
|
About 93% of all aviation fuel is consumed in the Northern Hemisphere and 7%
in the Southern Hemisphere (Baughcum et al., 1996; see Chapter
9). Within the Northern Hemisphere, 76% of aviation fuel is consumed at
mid- and polar latitudes (> 30°N). The geographical and altitude distribution
of current aviation fuel consumption implies that the largest changes in aerosol
and gas composition from aviation will be at northern mid-latitudes at altitudes
of 10 to 12 km.
3.3.2. Sulfate Aerosol
3.3.2.1. Stratosphere
The background stratospheric sulfate layer is believed to be formed largely
via the transport of carbonyl sulfide (OCS) into the stratosphere, its subsequent
conversion to H2SO4 (Crutzen, 1976), and condensation of H2SO4 onto small particles
nucleated primarily near the equatorial tropopause (Brock et al., 1995; Hamill
et al., 1997). Current global photochemical models estimate that the natural
source from OCS contributes 0.03 to 0.06 Tg S yr-1 into the stratosphere (Chin
and Davis, 1995; Weisenstein et al., 1997). Additional sources of stratospheric
sulfur may be required to balance the background sulfur budget (Chin and Davis,
1995), such as a strong convective transport of SO2 precursors (Weisenstein
et al., 1997). Large increases in H2SO4 mass in the stratosphere often occur
in periods following volcanic eruptions (Trepte et al., 1993). Increased H2SO4
increases the number and size of stratospheric aerosol particles (Wilson et
al., 1993). The relaxation to background values requires several years, as Figure
3-6 illustrates with aerosol extinction measurements derived from satellite
observations. The relative effect of aircraft emissions will be reduced in periods
of strong volcanic activity, particularly in the stratosphere, because the aircraft
source of aerosol becomes small compared with the volcanic source (see Table
3-1).
The current subsonic fleet injects ~0.02 Tg S yr-1 into the stratosphere under
the assumption that one-third of aviation fuel is consumed in the stratosphere
(Hoinka et al., 1993; Berger et al., 1994) (see Table
3-2). This amount is 1.5 to 3 times less than natural sources of stratospheric
sulfur in nonvolcanic periods. The enhanced sulfate aerosol surface area in
the stratosphere affects ozone photochemistry through surface reactions that
reduce nitrogen oxides and release active chlorine species (Weisenstein et al.,
1991, 1996; Bekki and Pyle, 1993; Fahey et al., 1993; Borrmann et al., 1996;
Solomon et al., 1997). The chemical impact of sulfate aerosol in the stratosphere
is discussed in Chapters 2 and 4.
3.3.2.2. Troposphere
Anthropogenic and natural sources of sulfur are much larger in the troposphere
than in the stratosphere (Table 3-2). Anthropogenic
emissions of sulfur exceed natural sources by factors of 2 to 3 on a global
scale, and emission in the Northern Hemisphere exceeds that in the Southern
Hemisphere by a factor of 10 (Langner and Rodhe, 1991). Accordingly, aerosol
abundance is larger in the upper troposphere than in the stratosphere and larger
in the Northern Hemisphere troposphere than in the Southern Hemisphere counterpart
(Hofmann, 1993; Benkovitz et al., 1996; Rosen et al., 1997; Thomason et al.,
1997a,b) (Figure 3-6). Tropospheric aerosol concentrations
are much larger than lower stratospheric concentrations under nonvolcanic conditions.
Condensation nucleus number densities exceeding 1,000 cm-3 are not uncommon
in the troposphere (Schröder and Ström, 1997; Hofmann et al., 1998), whereas
values in the lower stratosphere are less than 50 cm-3 in nonvolcanic periods
(Wilson et al., 1993).
The effect of aircraft sulfur emissions on aerosol in the upper troposphere
and lower stratosphere is far larger than comparison of their amount with global
sulfur sources suggests. The major surface sources of tropospheric sulfate aerosol
include SO2 and dimethyl sulfide (DMS), both of which have tropospheric lifetimes
of less than 1 week (Langner and Rodhe, 1991; Weisenstein et al., 1997). There
is large variability in upper tropospheric aerosol particle number and size
(Hofmann, 1993; Thomason et al., 1997b) because of variability in tropospheric
meteorology and the short lifetime of sulfur source gases. Surface emissions
are known to reach the upper troposphere under certain conditions, such as during
deep mid-latitude and tropical convection (Arnold et al., 1997; Prather and
Jacob, 1997; Dibb et al., 1998; Talbot et al., 1998). Only a small fraction
of the surface sulfur emissions reaches the upper troposphere, however, because
of the large removal rates of sulfur species near the surface.
Table 3-3: Non-volcanic upper tropospheric annual mean
optical depth and % change per year, along with standard deviation, from
SAGE satellite observations during 1979-97. Values in parentheses are for
the Southern Hemisphere (adapted from Kent et al., 1998).
|
| Latitude Band |
Annual Mean Optical Depth (10-4) |
Change per Year (%) |
| |
|
|
| 80-60° N(S) |
25.1 ± 4.7 (2.9 ± 0.9) |
-0.4 ± 0.2 (-0.7 ± 0.6) |
| 60-40° N(S) |
18.1 ± 4.7 (7.0 ± 1.0) |
0.4 ± 0.2 (1.4 ± 0.3) |
| 40-20° N(S) |
19.3 ± 2.9 (15.2 ± 2.5) |
0.2 ± 0.1 (1.2 ± 0.2) |
| 20-0° N(S) |
19.6 ± 0.9 (18.2 ± 1.6) |
0.2 ± 0.1 (0.8 ± 0.1) |
| Hemisphere N(S) |
|
0.1 ± 0.1 (0.9 ± 0.3) |
| Globe |
|
0.5 ± 0.2 |
|
|
3.3.2.3. Differences between the Upper Troposphere and
Lower Stratosphere
The effects of aircraft emissions on aerosol particles and aerosol precursors
depend on the amounts emitted into the troposphere and stratosphere. In addition
to aerosol abundance and sources, stratospheric and tropospheric aerosols also
differ in composition and residence time. Typical parameters for sulfate at
12 and 20 km at northern mid-latitudes are summarized in Table
3-1.
Sulfate is considered to be the dominant component of stratospheric aerosol;
soot and metals are considered to be minor components (Pueschel, 1996). The
composition of tropospheric aerosol, particularly near the surface, also includes
ammonium, minerals, dust, sea salt, and organic particles (Warneck, 1988). The
role of minor components of aerosol composition in affecting heterogeneous reaction
rates is not fully understood. In general, the lower stratosphere contains highly
concentrated H2SO4/H2O particles (65-80% H2SO4 mass fraction) as a result of
low relative humidity in the stratosphere and low temperatures (Steele and Hamill,
1981; Carslaw et al., 1997). Higher H2O abundances (by a factor of 10 or more)
and similar temperatures cause particles in the upper troposphere to be more
dilute (40-60% H2SO4). Surface reactions that activate chlorine are particularly
effective on dilute H2SO4 particles and cirrus cloud particles at low temperatures
in the tropopause region (Chapter 2).
Aircraft emissions injected into the stratosphere have greater potential to
perturb the aerosol layer than those emitted into the troposphere, because in
the stratosphere the background concentrations are lower and the residence times
are longer. The initial residence time (1/e-folding time) of most of the stratospheric
sulfate aerosol mass from volcanic eruptions is about 1 year as a result of
aerosol sedimentation rates (Hofmann and Solomon, 1989; Thomason et al., 1997b;
Barnes and Hofmann, 1997) (see also Figure 3-6). The
residence time of the remaining aerosol mass contained in smaller particles
is several years. The residence time of upper tropospheric aerosol particles
is much smaller, ranging from several days (Charlson et al., 1992) to between
10 and 15 days (Balkanski et al., 1993; Schwartz, 1996). Tropospheric particles
are larger than those in the stratosphere (Hofmann, 1990), therefore sediment
faster. They are also removed by cloud scavenging and rainout.
3.3.3. Observations of Aircraft-Produced Aerosol and
Sulfate Aerosol Changes
Observations of aircraft-induced aerosols have increased substantially in recent
years (see Section 3.2). Concentrations of aerosol particles
and aerosol precursor gases well above background values have been observed
in the exhaust plumes of aircraft operating in the upper troposphere and lower
stratosphere. Although aircraft emissions are quickly diluted by mixing with
ambient air to near background values, the accumulation of emissions in flight
corridors used in the routing of commercial air traffic has the potential to
cause notable atmospheric changes.
|
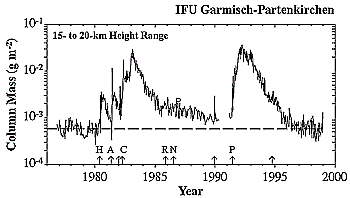
Figure 3-7: Aerosol-mass column between 15- and 20-km altitude,
derived from backscatter measurements made by lidar at Garmisch-Partenkirchen,
Germany, between 1976 and end of 1998.
|
|
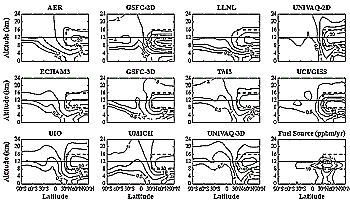
Figure 3-8: Zonally and annually averaged distribution of fuel tracer
in ng(tracer)/g(air), according to indicated models.
|
Estimated changes from aircraft emissions (Schumann, 1994; WMO, 1995) are small
compared with natural variability, hence are not always apparent in observational
data sets. However, regional enhancements in concentrations of aircraft-produced
aerosol have been observed near air traffic corridors. During measurement flights
across the North Atlantic flight corridor over the eastern Atlantic, signatures
of NOx, SO2, and condensation nuclei (CN) were clearly evident in the exhaust
plumes of 22 aircraft that passed the corridor at this altitude in the preceding
3 h, with values exceeding background ambient levels by 30, 5, and 3 times,
respectively (Schlager et al., 1997). A mean CN/NOx abundance ratio of 300 cm-3
ppbv-1 was measured. This ratio corresponds to a mean particle emission index
of about 1016 kg-1 and implies CN increases of 30 cm-3 in corridor regions where
aircraft increase NOx by 0.1 ppbv (cf. Chapter 2). The
regional perturbation was found to be detectable at scales of more than 1,000
km under special meteorological conditions within a long-lasting stagnant anticyclone
(Schlager et al., 1996). In an analysis of 25 years of balloon measurements
in Wyoming in the western United States of America, subsonic aircraft are estimated
to contribute about 5-13% of the CN concentration at 8-13 km, depending on the
season (Hofmann et al., 1998). This estimate provides only a lower bound of
the aircraft contribution because smaller aircraft-produced particles (radius
< 10 nm) are not detected. Additionally, regular lidar measurements have been
made of aerosol optical depth at aircraft altitudes (10-13 km) in an area of
heavy air traffic in southern Germany (Jäger et al., 1998). Large optical depths
on the order of 0.1 that could be attributed to the accumulation of aircraft
aerosol were observed very rarely at this location.
Global changes in sulfate aerosol properties at subsonic air traffic altitudes
were small over the last few decades. The examination of long-term changes in
aerosol parameters suggests that aircraft operations up to the present time
have not substantially changed the background aerosol mass. Multiyear observations
for the upper troposphere and lower stratosphere are available from satellite
and balloon platforms and ground-based lidar systems. Long-term variations of
the optical depth in the upper troposphere from the SAGE satellite (Figure
3-6 and Table 3-3) have been analyzed with periods
of volcanic influence excluded (Kent et al., 1998). Data indicate that changes
are less than about 1% yr-1 between 1979 and 1998, when observations
are averaged over either hemisphere. A significant change in aerosol amounts
is also not found in the 15- to 30-km region examined with lidar over Mauna
Loa (20°N) for the period 1979 to 1996 (Barnes and Hofmann, 1997). Similarly,
aerosol mass data above the tropopause derived from lidar soundings show no
trend in a region of heavy air traffic in Germany (48°N) over the last 22 years
(Figure 3-7) (Jäger and Hofmann, 1991; Jäger et
al., 1998).
Table 3-4: Results from the 1992 fuel tracer simulations
(other results included in Table 3-1).
|
| Modela |
Max.
Tracer
Value
(ng g-1) |
Latitude
of Max.
(°N) |
Global
Residence
Time
(days) |
Tracer
8-16 km
30-90°N
(%) |
Tracer
>12km
(%) |
Max.
Tracer
Columnb
(mg cm-2) |
Global
Soot
Column
(ng cm-2) |
Global
SO4
Columnc
(ng cm-2) |
| |
|
|
|
|
|
|
|
|
| 2-D Models |
|
|
|
|
|
|
|
|
| AER |
26.7 |
55 |
38 |
34 |
45 |
6.6 |
0.11 |
3.5 |
| GSFC-2D |
122 |
55 |
62 |
61 |
16 |
22.9 |
0.20 |
5.9 |
| LLNL |
72.5 |
65 |
65 |
42 |
38 |
14.5 |
0.20 |
6.0 |
| UNIVAQ-2D |
36.4 |
60 |
23 |
58 |
33 |
7.7 |
0.08 |
2.2 |
| |
|
|
|
|
|
|
|
|
| 3-D Models |
|
|
|
|
|
|
|
|
| ECHAm3 |
12.6 |
50 |
22 |
34 |
31 |
4.1 |
0.07 |
2.0 |
| GSFC-3D |
46.7 |
50 |
52 |
44 |
29 |
11.7 |
0.16 |
4.9 |
| Tm3 |
20.1 |
80 |
21 |
45 |
40 |
4.9 |
0.07 |
2.0 |
| UCI/GISS |
34.4 |
55 |
27 |
49 |
14 |
8.2 |
0.09 |
2.6 |
| UiO |
28.2 |
55 |
29 |
50 |
40 |
7.8 |
0.09 |
2.7 |
| UMICH |
30.4 |
65 |
45 |
37 |
44 |
9.6 |
0.14 |
4.2 |
| UNIVAQ-3D |
38.4 |
50 |
25 |
50 |
41 |
7.7 |
0.08 |
2.3 |
|
|
a) Models are denoted as follows: 2-D-Atmospheric and
Environmental Research (AER) (Weisenstein et al., 1998), Goddard Space Flight
Center (GSFC-2D) (Jackman et al., 1996), Lawrence Livermore National Laboratory
(LLNL) (Kinnison et al., 1994), University of L'Aquila (UNIVAQ-2D) (Pitari
et al., 1993); 3-D-German Aerospace Center (DLR) (ECHAm3) (Sausen and Köhler,
1994), Goddard Space Flight Center (GSFC-3D) (Weaver et al., 1996), Royal
Netherlands Meteorological Institute (KNMI) (Tm3) (Wauben et al., 1997),
University of California at Irvine (UCI/GISS) (Hannegan et al., 1998), University
of Oslo (UiO) (Berntsen and Isaksen, 1997), University of Michigan(UMICH)
(Penner et al., 1991), UNIVAQ-3D (Pitari, 1993).
b) Column amounts calculated between 0-60 km for all models except
ECHAm3 and Tm3 (0-32 km) and UiO (0-26 km).
c These values are calculated from model results with assumptions of EI(soot)
of 0.04 g/kg fuel, EI(sulfur)
of 0.4 g/kg fuel, and 100% conversion of sulfur to H2SO4. |
|
Long-term changes in aerosol parameters measured in situ are also small. In
situ measurements are important because the number of particles in the upper
troposphere and lowermost stratosphere is dominated by sizes that are too small
(< 0.15-mm radius) to be remotely detected. Long-term changes in CN are small
in the 10- to 12-km region of the mid-latitude troposphere, where most of the
current aircraft fleet operates (Hofmann, 1993). The 5% yr-1 increase in larger
particle (radius > 0.15 mm) abundances found in lower stratospheric balloon
measurements made between 1979 and 1990 was considered consistent with the accumulation
of aircraft sulfur emissions (Hofmann, 1990, 1991). However, the absence of
a change in observed stratospheric CN number suggests that the trend in the
larger particles is the result of the growth of existing particles rather than
nucleation of new particles. Model results show that the contribution of the
current subsonic fleet to aerosol mass amounts between 15 and 20 km is about
100 times smaller than the observed aerosol amounts (Section
3.3.4; Bekki and Pyle, 1992). Previous balloon-borne CN counters did not
measure particles below 10 nm in radius, which are now detected with more modern
CN counters and dominate aerosol number in aircraft plumes. Moreover, the attribution
of aerosol changes to aircraft is complicated by changes in surface sources
of sulfur and episodic strong injections of sulfur from volcanic eruptions (Hitchman
et al., 1994; Barnes and Hofmann, 1997; Thomason et al., 1997a,b). Hence, the
contribution of aircraft emissions to changes or possible trends in these regions
is difficult to determine at present.
3.3.4. Modeling Sulfate Aerosol Perturbations Caused
by Aircraft
3.3.4.1. Subsonic Aircraft
Global models are required to evaluate the atmospheric impact of aerosol generated
by subsonic aircraft (Friedl, 1997; Brasseur et al., 1998). The global distribution
of tropospheric sulfur species has been investigated using various three-dimensional
(3-D) models (Langner and Rodhe, 1991; Penner et al., 1994; Chin et al., 1996;
Feichter et al., 1996; Pham et al., 1996; Schwartz, 1996). Because most models
have been developed to investigate regional or global effects of surface emissions
in the lower or middle troposphere, few have addressed the potential impact
of aviation sources on aerosol parameters in the upper troposphere and lower
stratosphere.
A systematic model study has been carried out with a suite of two-dimensional
(2-D) and 3-D atmospheric models to determine upper bounds for the accumulation
of aviation aerosol in the atmosphere (Danilin et al., 1998). Each model computed
the steady-state global distribution of a passive tracer emitted into the model
atmosphere with the same rate and distribution as aviation fuel use, based on
the NASA 1992 database (see Chapter 9). The only sink
for the passive tracer is below 400 hPa (approximately 7 km), where it is removed
with a 1/e-folding time of 5 days. The resultant global tracer distribution
can be used to provide estimates of steady-state concentration change from a
specific emission by multiplying the tracer value by the associated aircraft
engine emission index (EI). Figure 3-8 shows steady-state
tracer distributions in tracer-to-air mass mixing ratio units and annually and
zonally averaged fuel source used in the simulation. Table
3-4 summarizes the main results of these simulations.
|
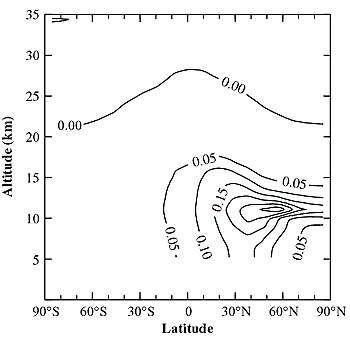
Figure 3-9: Latitude and altitude distribution of annually
averaged increase of surface area density of sulfate aerosol (in µm2 cm-3),
calculated with AER 2-D model assuming a 1992 aircraft fuel-use scenario,
0.4 g S/kg fuel, and 5% conversion of sulfur emissions into new particles
with a radius of 5 nm (adapted from Weisenstein et al., 1997).
|
All models predict the largest perturbation at mid-latitudes in the Northern
Hemisphere in the altitude range of 10-12 km. However, the magnitude of the
perturbation varies by a factor of 10, ranging from 12.6 (ECHAm3) to 122 ng
g-1 (GSFC-2D), reflecting differences in model resolution and current uncertainties
in modeling of global atmospheric dynamics and turbulent diffusion. To mitigate
the effects of model resolution, the tracer amount was summed in the 8- to 16-km
altitude region between 30 and 90°N (shown by the thick dashed line in Figure
3-8). This region contains 34 (AER, ECHAm3) to 61% (GSFC-2D) of the total
accumulated tracer. The absolute amount of tracer mass in this volume ranges
from 2.9 (ECHAm3) to 14.5 Tg (GSFC-2D). The amount of the tracer above 12 km,
which serves to diagnose the fraction of aircraft emissions transported toward
the stratospheric ozone maximum, ranges from 14 (UCI/GISS, GSFC-2D) to 45% (UMICH,
AER) of each model's global tracer amount. The global residence time of the
fuel tracer, defined as the ratio of the steady-state tracer mass to the tracer
source, varies from 21 days (Tm3, ECHAm3) to 65 days (GSFC-2D, LLNL). The lower
values are similar to the global residence times (approximately 18 days) found
for air parcels uniformly released at 11 km between 20 and 60°N and followed
with a trajectory model using assimilated wind fields (Schoeberl et al., 1998).
The 1/e-folding aircraft emissions lifetime of 50 days computed by Gettelman
(1998) is consistent with the results of the fuel tracer experiment described
here (Danilin et al., 1998).
The model simulation results indicate that aircraft contribute little to the
sulfate mass near the tropopause. For example, the sulfate aerosol mass density
from the GSFC-2D model (see Figure 3-8) is 0.055 mg
m-3 at 10 km at 55°N, in contrast to background concentrations of 1 to 2 mg
m-3 (Yue et al., 1994). Other recent model studies (Danilin et al., 1997; Kjellström
et al., 1998) show similar results for aerosol mass; these studies further conclude
that aircraft emissions may noticeably enhance the background number and surface
area densities (SAD) of sulfate aerosol (see Tables 3-1
and 3-4) because of the smaller radii of aircraft-produced
particles.
Fuel tracer simulation also provides estimates of soot and sulfate column amounts
that can be used to calculate the direct radiative forcing of current subsonic
fleet emissions (see Chapter 6). Maximum tracer column
values are located near 50 to 60°N and range from 4.1 (ECHAm3) to 22.9 mg cm-2
(GSFC-2D). To calculate instantaneous direct radiative forcing at the top of
the atmosphere from aircraft soot emissions, globally averaged tracer column
values (which are smaller than their maximum values by a factor of 3 to 4) are
first multiplied by EI(soot) to obtain soot column values. For aircraft sulfur
emissions, the tracer column is scaled by EI(S), the ratio of molar mass of
SO4 and S, and a 100% conversion fraction of sulfur to sulfate (see Table
3-4). For the suite of models in Table 3-4,
the upper bound for the average soot column is 0.1 ng cm-2, with a range from
0.07 to 0.20 ng cm-2; for the average sulfate column the upper bound is 2.9
ng cm-2, with a range from 2 to 6 ng cm-2. If photochemical oxidation lifetime
and tropospheric washout rate are taken into account, a 50% conversion fraction
of sulfur to sulfate is a more suitable value than 100%. In this case, the average
sulfate column is 1.4 ng cm-2, with a range of 1 to 3 ng cm-2.
|
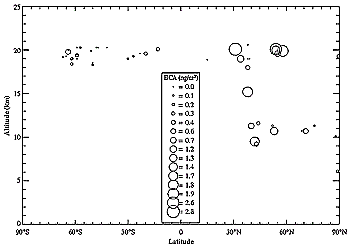
Figure 3-10: Latitude and altitude distribution of measured values of soot
concentrations (BCA = black carbon aerosol) in upper troposphere and lower stratosphere
(in ng m-3).
|
In addition to the passive tracer simulation, the AER 2-D model also calculated
the evolution of aerosol using a sulfur photochemistry and aerosol microphysics
model designed for stratospheric conditions (Weisenstein et al., 1997). This
model calculates about 3.4 ng cm-2 for the perturbation in sulfate aerosol at
55°N, consistent with the AER model value in Table 3-4
but almost 30 times smaller than the background sulfate column amounts (~100
ng cm-2). Figure 3-9 depicts the annually averaged
increase of sulfate aerosol SAD calculated with the AER 2-D model, assuming
5% conversion of sulfur emissions into new particles (as recommended in Section
3.2) with a radius of 5 nm and fuel with 0.4 g S/kg. The maximum SAD perturbation,
located at about 10-12 km in northern mid-latitudes, is about 0.3 mm2 cm-3,
which is comparable to ambient values in nonvolcanic periods (Hofmann and Solomon,
1989; Thomason et al., 1997b).
Table 3-1 presents upper-bound estimates of soot
and sulfate aerosol number and surface area densities from 1992 fuel simulations.
Present aircraft emissions noticeably increase the number and surface area densities
of aerosol particles in the tropopause region despite the large CN background
concentration in the upper troposphere. The estimates use the range of values
of computed tracer concentrations from all models and the effective EIs of soot
and sulfate mass and assume a mean particle size of 10(20) nm for sulfate (soot)
particles and a 5% conversion of sulfur to sulfate aerosol. The results represent
order-of-magnitude estimates of zonal mean maximum values at 12 km and can be
compared with background aerosol properties in the lowermost stratosphere as
given in Table 3-1. For these estimates, 5% of the
emitted sulfur dioxide is assumed to be converted to sulfuric acid before dispersal
out of the zonal region of maximum air traffic.
Tracer simulations strongly suggest that aircraft emissions are not the source
of observed decadal H2O changes at 40°N. The simulation results can be scaled
by EI(H2O) to provide an upper bound (neglecting precipitation from the upper
troposphere) for the accumulation of water vapor above the tropopause as a result
of aircraft emissions. The LLNL model shows the largest tracer accumulation
at 40°N, with equivalent H2O values smoothly decreasing from 55 ppbv at 10 km
to 12 ppbv at 24 km. These values are small in comparison to current ambient
values of 59 ppmv at 10-12 km and 4.2 ppmv at 22-24 km (Oltmans and Hofmann,
1995). Assuming 5% yr-1 growth in fuel consumption and EI(H2O) of 1.23 kg/kg,
the change in aircraft-produced H2O ranges from 3.4 ppbv yr-1 at 10 km to 0.8
ppbv yr-1 at 24 km. These values represent a change of +0.006% yr-1 at 10 km
and +0.018% yr-1 at 24 km and are more than of 20 times smaller than those found
in long-term balloon observations (Oltmans and Hofmann, 1995).
3.3.4.2. Supersonic Aircraft
The impact of a future fleet of supersonic aircraft on sulfate aerosol abundance
in the stratosphere has been discussed using measurements and model results
(Bekki and Pyle, 1993; Fahey et al., 1995a; Stolarski et al., 1995; Weisenstein
et al., 1996, 1998). The results suggest that aerosol surface area density will
be substantially greater than nonvolcanic background values in proposed fleet
scenarios (Section 3.7 and Chapter 4). The consequences for stratospheric ozone changes depend on the simultaneous
emissions of nitrogen oxides and chlorine and aerosol loadings of the atmosphere
(Solomon et al., 1997; Weisenstein et al., 1998; see also Chapter
2).
|