| 3.8
|
Globally averaged annual precipitation
is projected to increase during the 21st century. Globally averaged
water vapor and evaporation are also projected to increase.
|
 WGI
TAR Section 9.3.1 WGI
TAR Section 9.3.1 |
| 3.9 |
Global mean sea level is projected to
rise by 0.09 to 0.88 m between the years 1990 and 2100, for the full range
of SRES scenarios (see Figure 3-1).
For the periods 1990 to 2025 and 1990 to 2050, the projected rises are 0.03
to 0.14 m and 0.05 to 0.32 m, respectively. This is due primarily to thermal
expansion and loss of mass from glaciers and ice caps. The range of sea-level
rise presented in the SAR was 0.13 to 0.94 m, based on the IS92 scenarios.
Despite the higher temperature change projections in this assessment, the
sea-level projections are slightly lower, primarily due to the use of improved
models, which give a smaller contribution from glaciers and ice sheets.
|
WGI
TAR Section 11.5.1 |
| 3.10 |
Substantial differences are projected
in regional changes in climate and sea level, compared to the global mean
change.
|
|
| 3.11 |
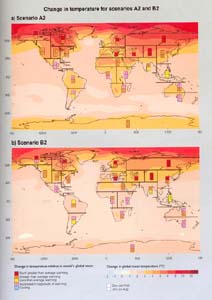
It is very likely that nearly all land
areas will warm more rapidly than the global average, particularly those
at northern high latitudes in winter. Most notable of these is the
warming in the northern regions of North America, and northern and central
Asia, which exceeds global mean warming in each model by more than 40%.
In contrast, the warming is less than the global mean change in south and
southeast Asia in summer and in southern South America in winter (see Figure
3-2).
|
WGI
TAR Section 10.3.2 |
| 3.12 |
At the regional scale, both increases
and decreases in precipitation are projected, typically of 5 to 20%.
It is likely that precipitation will increase over high latitude regions
in both summer and winter. Increases are also projected over northern mid-latitudes,
tropical Africa and Antarctica in winter, and in southern and eastern Asia
in summer. Australia, Central America, and southern Africa show consistent
decreases in winter rainfall. Larger year-to-year variations in precipitation
are very likely over most areas where an increase in mean precipitation
is projected (see Figure 3-3).
|
WGI
TAR Section 10.3.2 |
| 3.13 |
The projected range of regional variation
in sea-level change is substantial compared to projected global average
sea-level rise, because the level of the sea at the shoreline is determined
by many factors (see Figure 3-4). Confidence
in the regional distribution of sea-level change from complex models is
low because there is little similarity between model results, although nearly
all models project greater than average rise in the Arctic Ocean and less
than average rise in the Southern Ocean.
|
WGI
TAR Section 11.5.2 |
| 3.14 |
Glaciers and ice caps are projected to
continue their widespread retreat during the 21st century. Northern
Hemisphere snow cover, permafrost, and sea-ice extent are projected to decrease
further. The Antarctic ice sheet is likely to gain mass because of greater
precipitation, while the Greenland ice sheet is likely to lose mass because
the increase in runoff will exceed the precipitation increase. Concerns
that have been expressed about the stability of the West Antarctic ice sheet
are covered in Question 4. |
WGI
TAR Section 11.5.4 |
| |
Figure 3-2: The background
shows the annual mean change of temperature (color shading) for (a) the
SRES
scenario A2 and (b) the SRES scenario B2. Both SRES scenarios show
the period 2071 to 2100 relative to the period 1961 to 1990, and were performed
by AOGCMs. Scenarios A2 and B2 are shown as no AOGCM runs were available
for the other SRES scenarios. The boxes show an analysis of inter-model
consistency in regional relative warming (i.e., warming relative to each
model's global average warming) for the same scenarios. Regions are
classified as showing either agreement on warming in excess of 40% above
the global mean annual average (much greater than average warming), agreement
on warming greater than the global mean annual average (greater than average
warming), agreement on warming less than the global mean annual average
(less than average warming), or disagreement amongst models on the magnitude
of regional relative warming (inconsistent magnitude of warming). There
is also a category for agreement on cooling (this category never occurs).
A consistent result from at least seven of the nine models is defined as
being necessary for agreement. The global mean annual average warming of
the models used span 1.2 to 4.5°C for A2 and 0.9 tO3.4°C
for B2, and therefore a regional 40% amplification represents warming ranges
of 1.7 to 6.3°C for A2 and 1.3 to 4.7°C for B2. |
WGI TAR Figures 9.10d &
9.10e, & WGI TAR
Box 10.1 (Figure 1) |
|
|